Monitoring and Management
To ensure the smooth and continuous operation of gwcelery, constant monitoring of the various systems is paramount.
Monitoring Responsibilities
There is a weeklong rotating position among gwcelery librarians involving active monitoring and management of gwcelery, with the following explicit responsibilities:
Handle new releases, both creation and following up on active SCCB issues
Check issues on Sentry
Follow up on Nagios issues
Handle active issues, especially in those latest milestones
Dig through stale issues, assigning, bumping, or working on
Check on security updates
GWCelery supports a rich selection of management and monitoring tools. Here is an introduction to a few of them. For more Celery monitoring solutions, see the Celery monitoring and management guide.
Flower
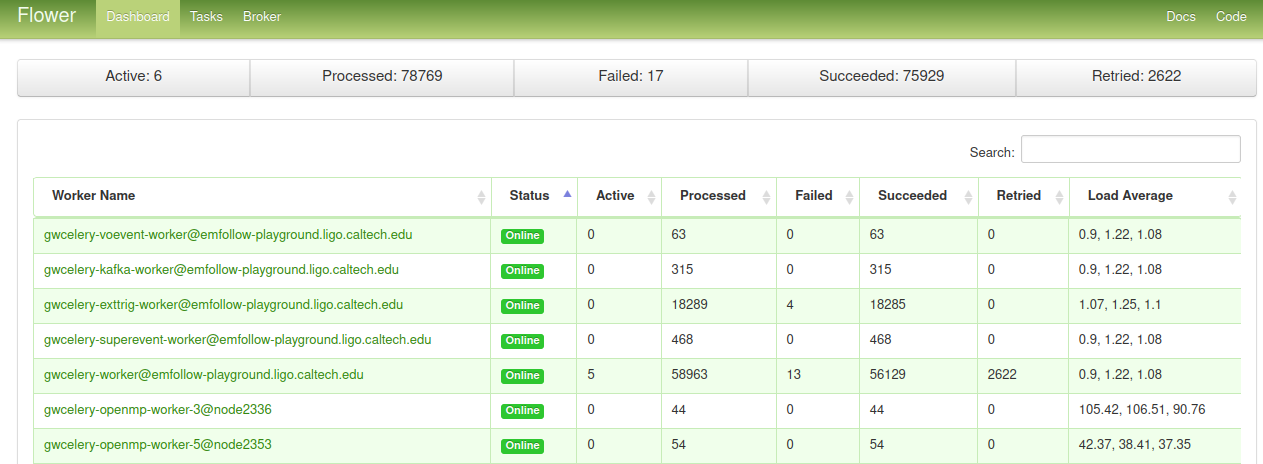
Flower is a dashboard for monitoring Celery tasks. It provides a good first look to check if everything is running as expected. Any offline worker will be show in red. By clicking on a failed worker or task, one can get some details about the failure reason. Flower does not store the results persistently (Sentry is a better tool to look at historical data).
The production instance is available at https://emfollow.ligo.caltech.edu/flower/.
To start Flower for monitoring during local development, run the following command and then navigate to http://localhost:5555/ in your browser:
$ gwcelery flower
Sentry
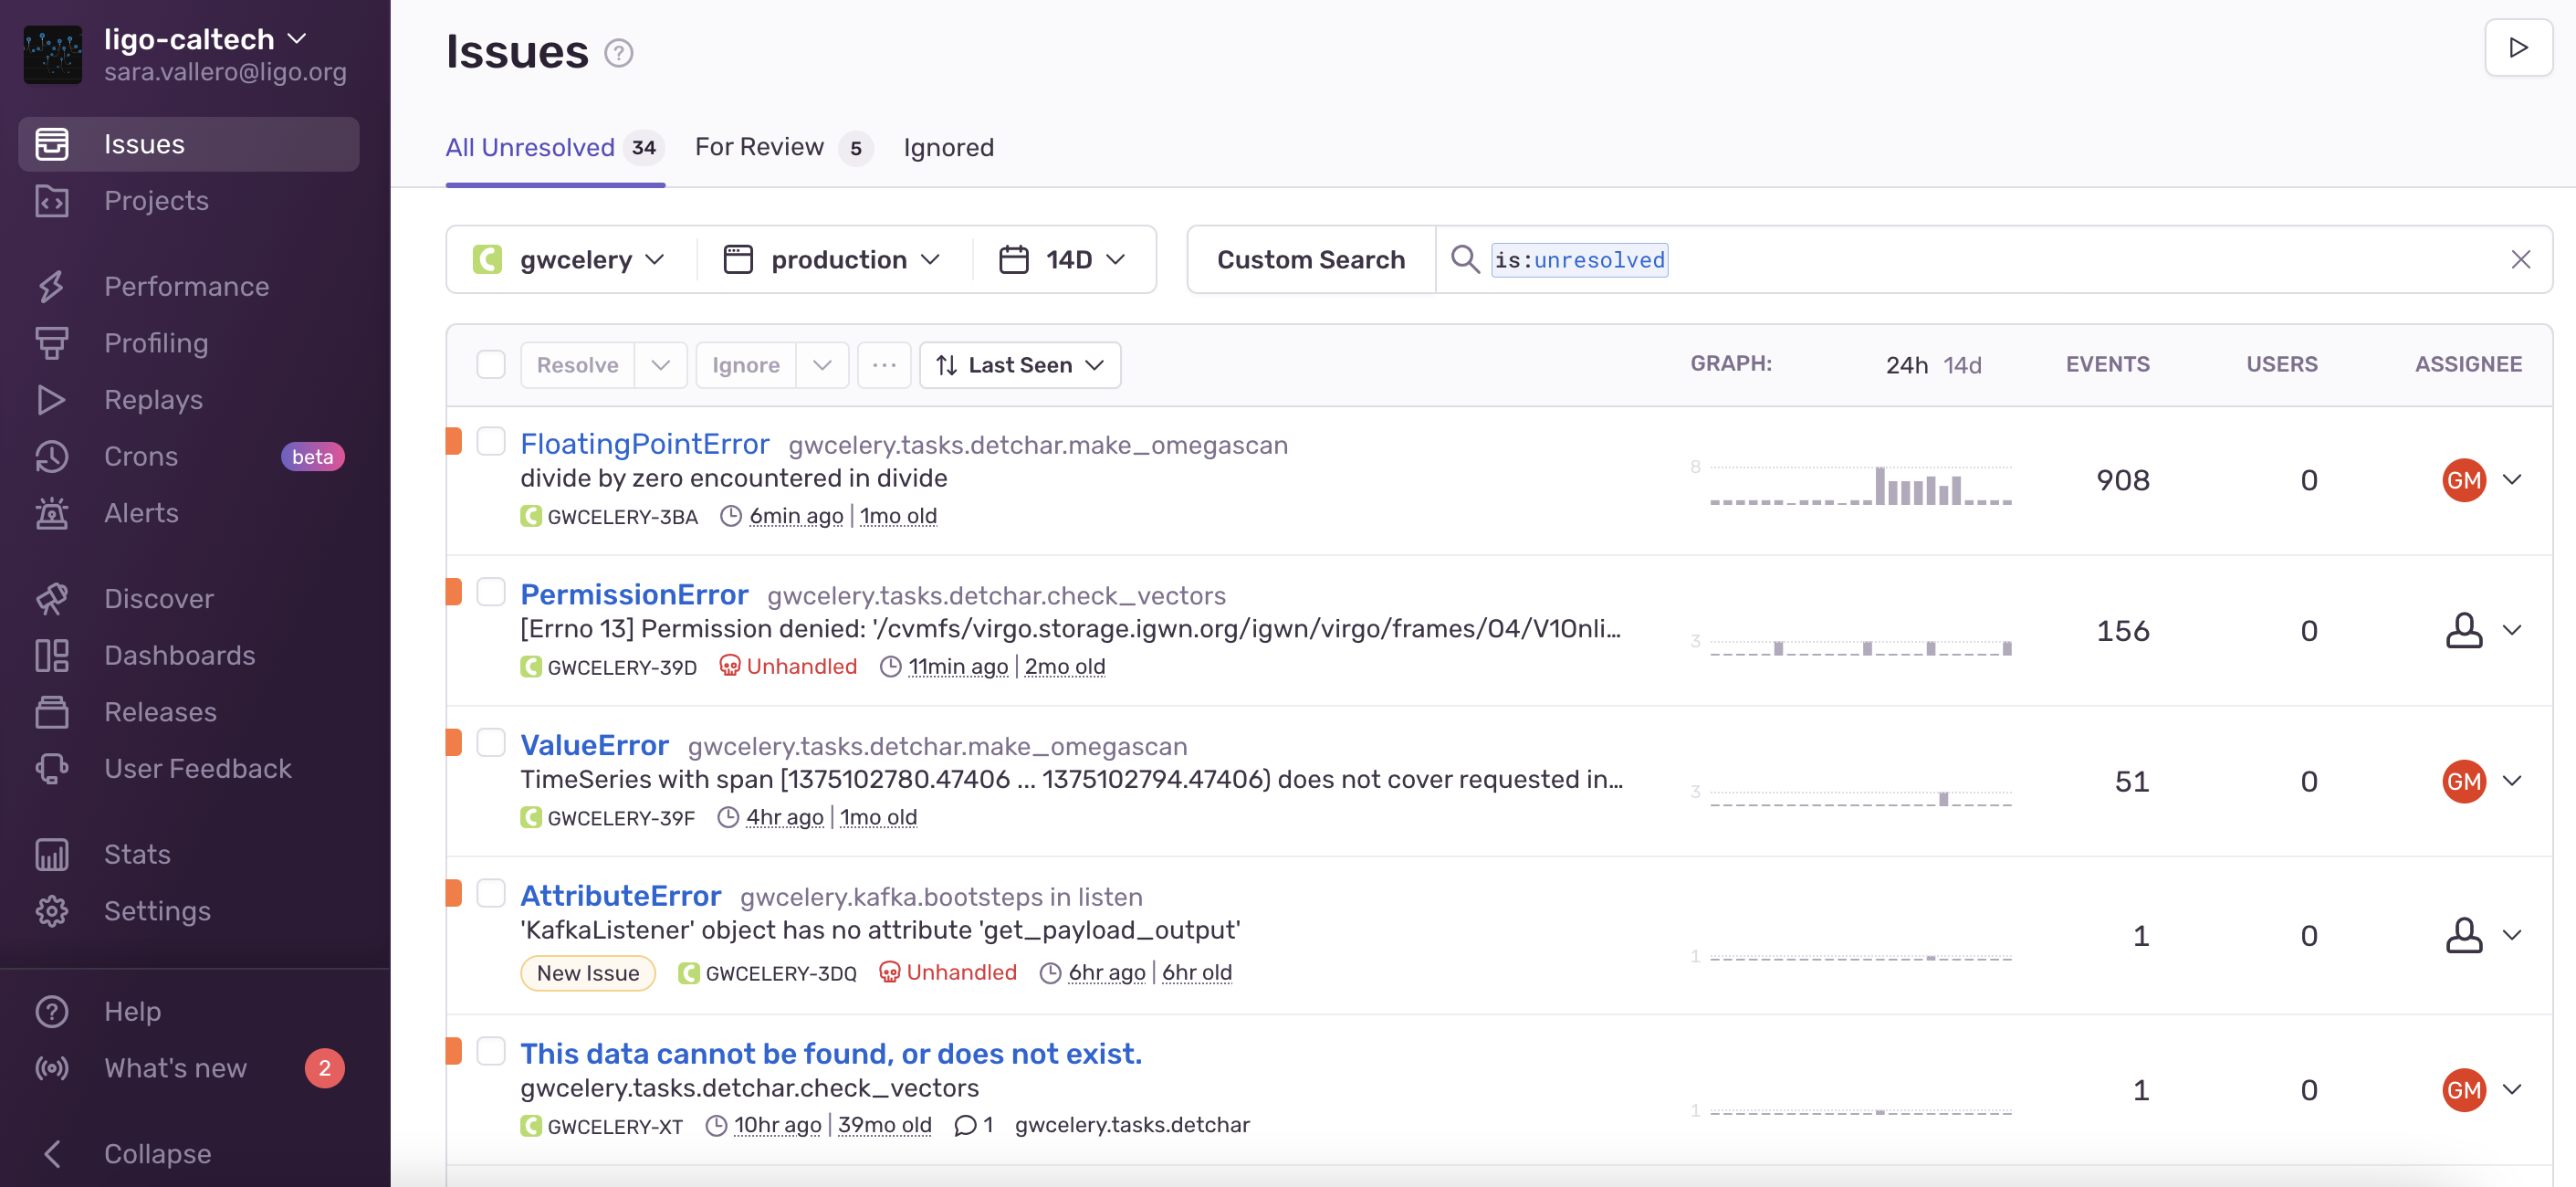
All warnings, errors, exceptions, and tasks failures are both logged to disk and uploaded instantly to Sentry, an error monitoring and reporting platform. Sentry notifies GWCelery contributors by email when a new bug occurs.
Sentry monitoring of the production instance of GWCelery is available here. Other environments (i.e. playground or test) can be chosen from the top bar, as well as the monitoring period.
By clicking on a specific issue one can get more details about the issue itself, including the code snippet generating the problem. On the right sidebar of the specific issue page, there is the possibility to automatically open a corresponding issue in the LIGO GitLab instance.
For details about the Sentry logging configuration, see the
gwcelery.sentry module or the Celery integration module in the Sentry
SDK docs.
Nagios
Note
The GWCelery Nagios plugin is tailored to GWCelery and is not sufficiently general to use with other Celery applications.
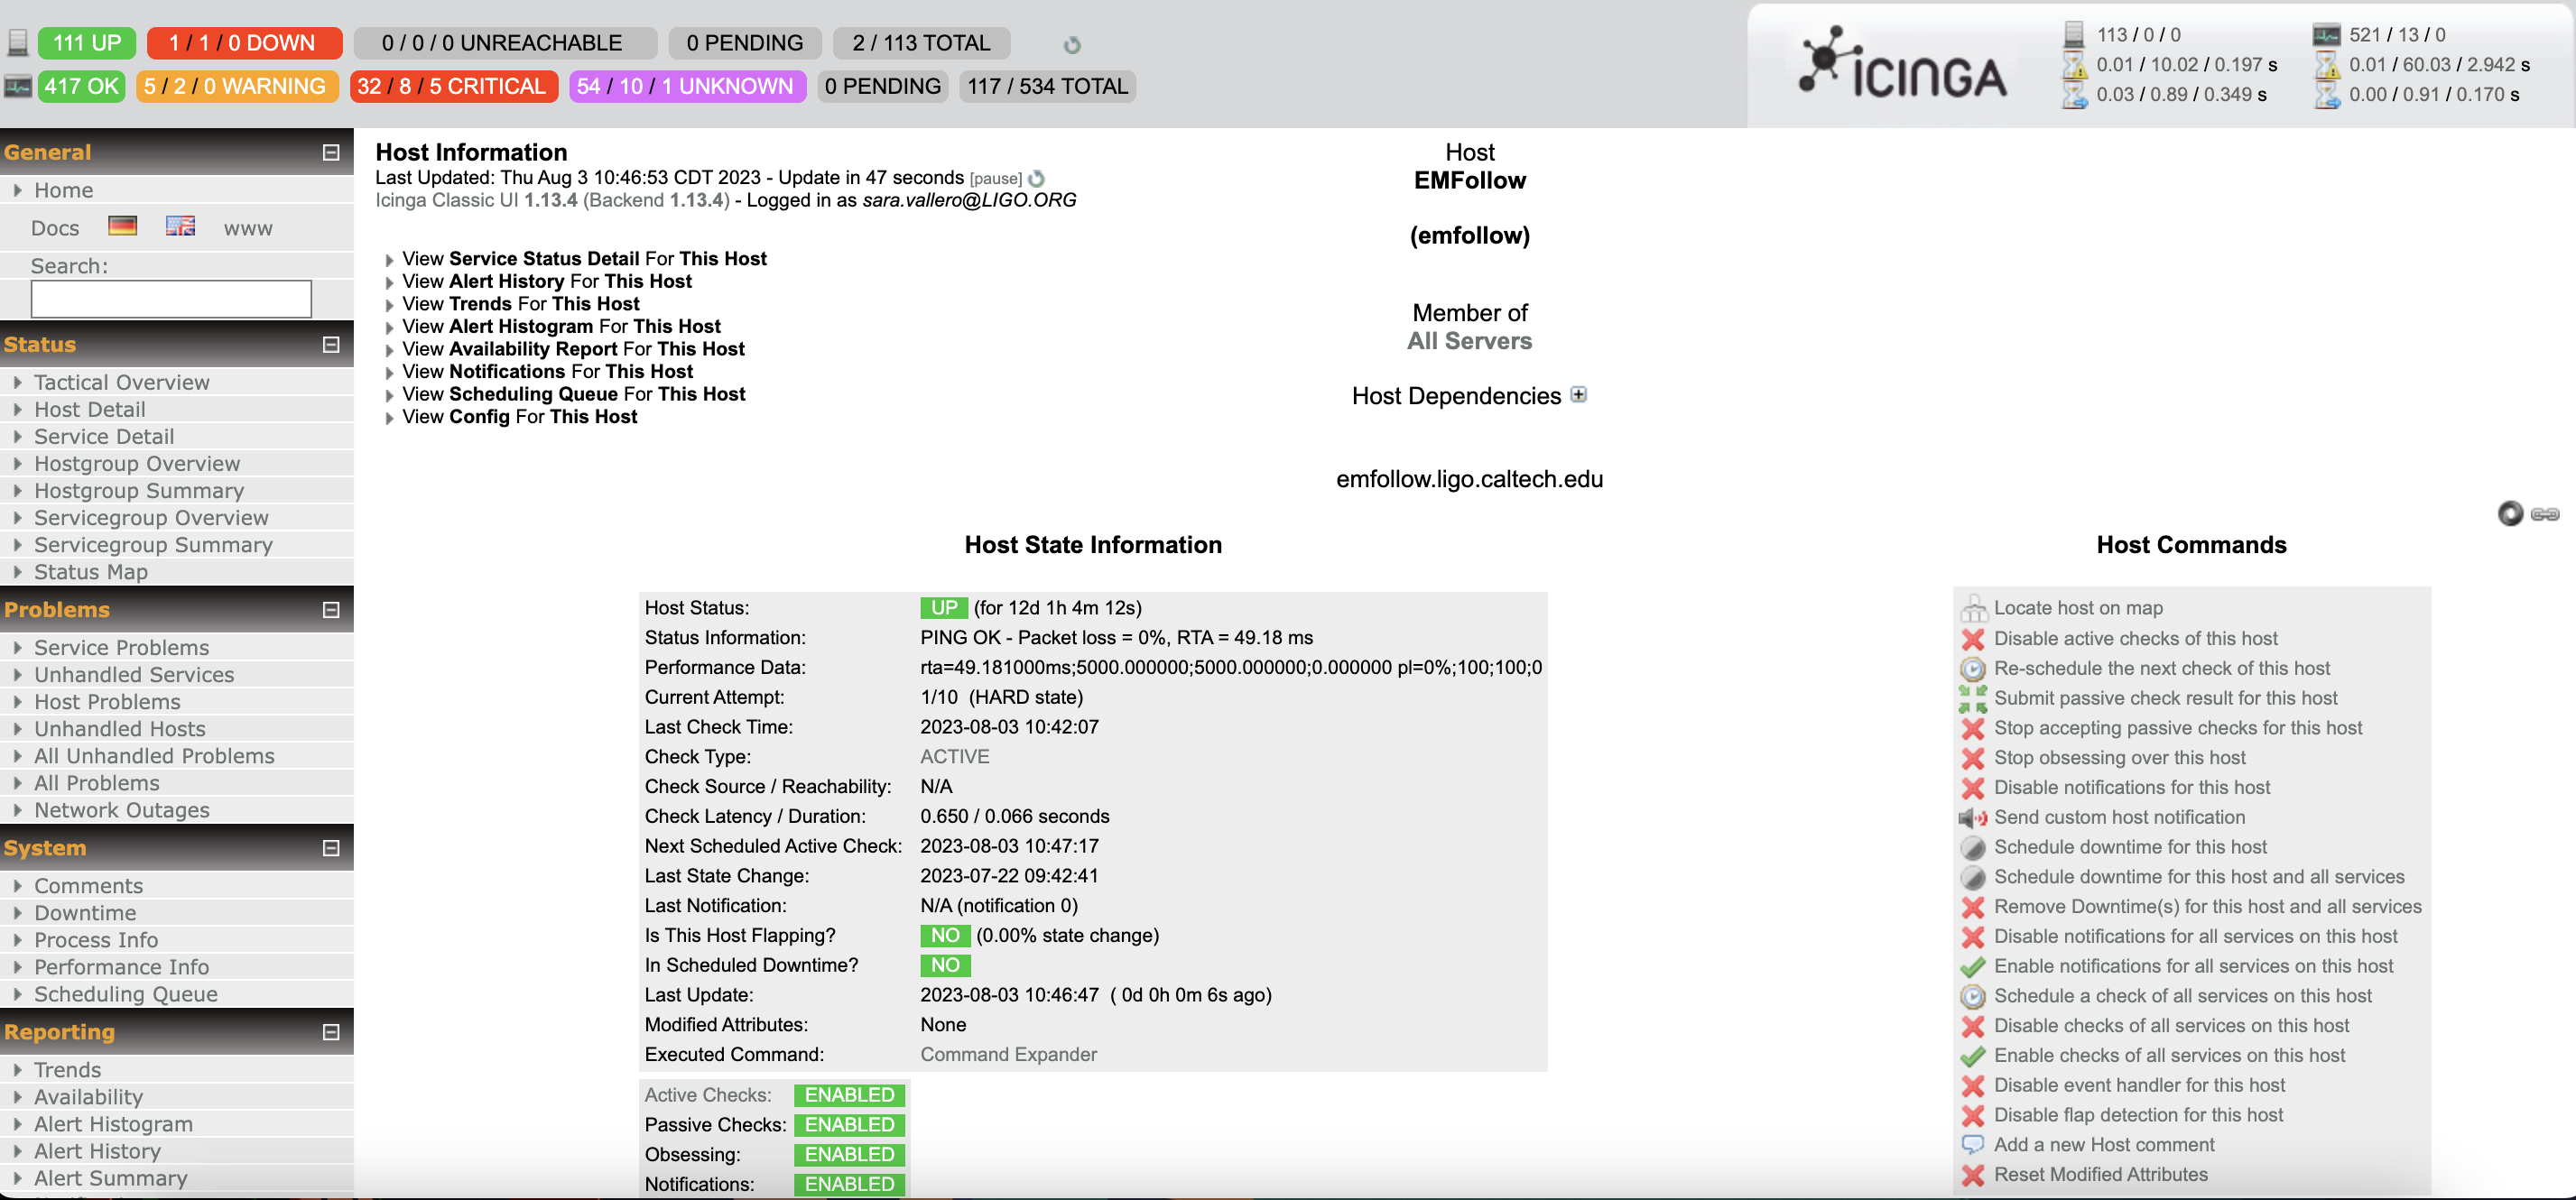
The dashboard.ligo.org service uses Nagios to monitor and report on the health of all of the components of the low-latency analysis infrastructure.
The status of the host running the production instance of GWCelery can be found under Host Detail in the left side menu (select the emfollow entry). From the host information page, the links to the GWCelery service status or to the alert history and other useful monitoring pages can be found in the top left of the page.
Moreover, GWCelery provides the command gwcelery nagios to check the status of the
application and provide a report in the format that Nagios expects.
You can run it manually from the command line:
$ gwcelery nagios
OK: GWCelery is running normally
To configure Nagios itself, see the Nagios configuration overview, or if GWCelery and Nagios are running on different hosts, the Nagios Remote Plugin Executor (NRPE) documentation.
Ganglia
Ganglia is used to to view either live or recorded statistics covering metrics such as: CPU, memory, disk, network or network utilization.
The machine running the production instance of GWCelery is monitored here.
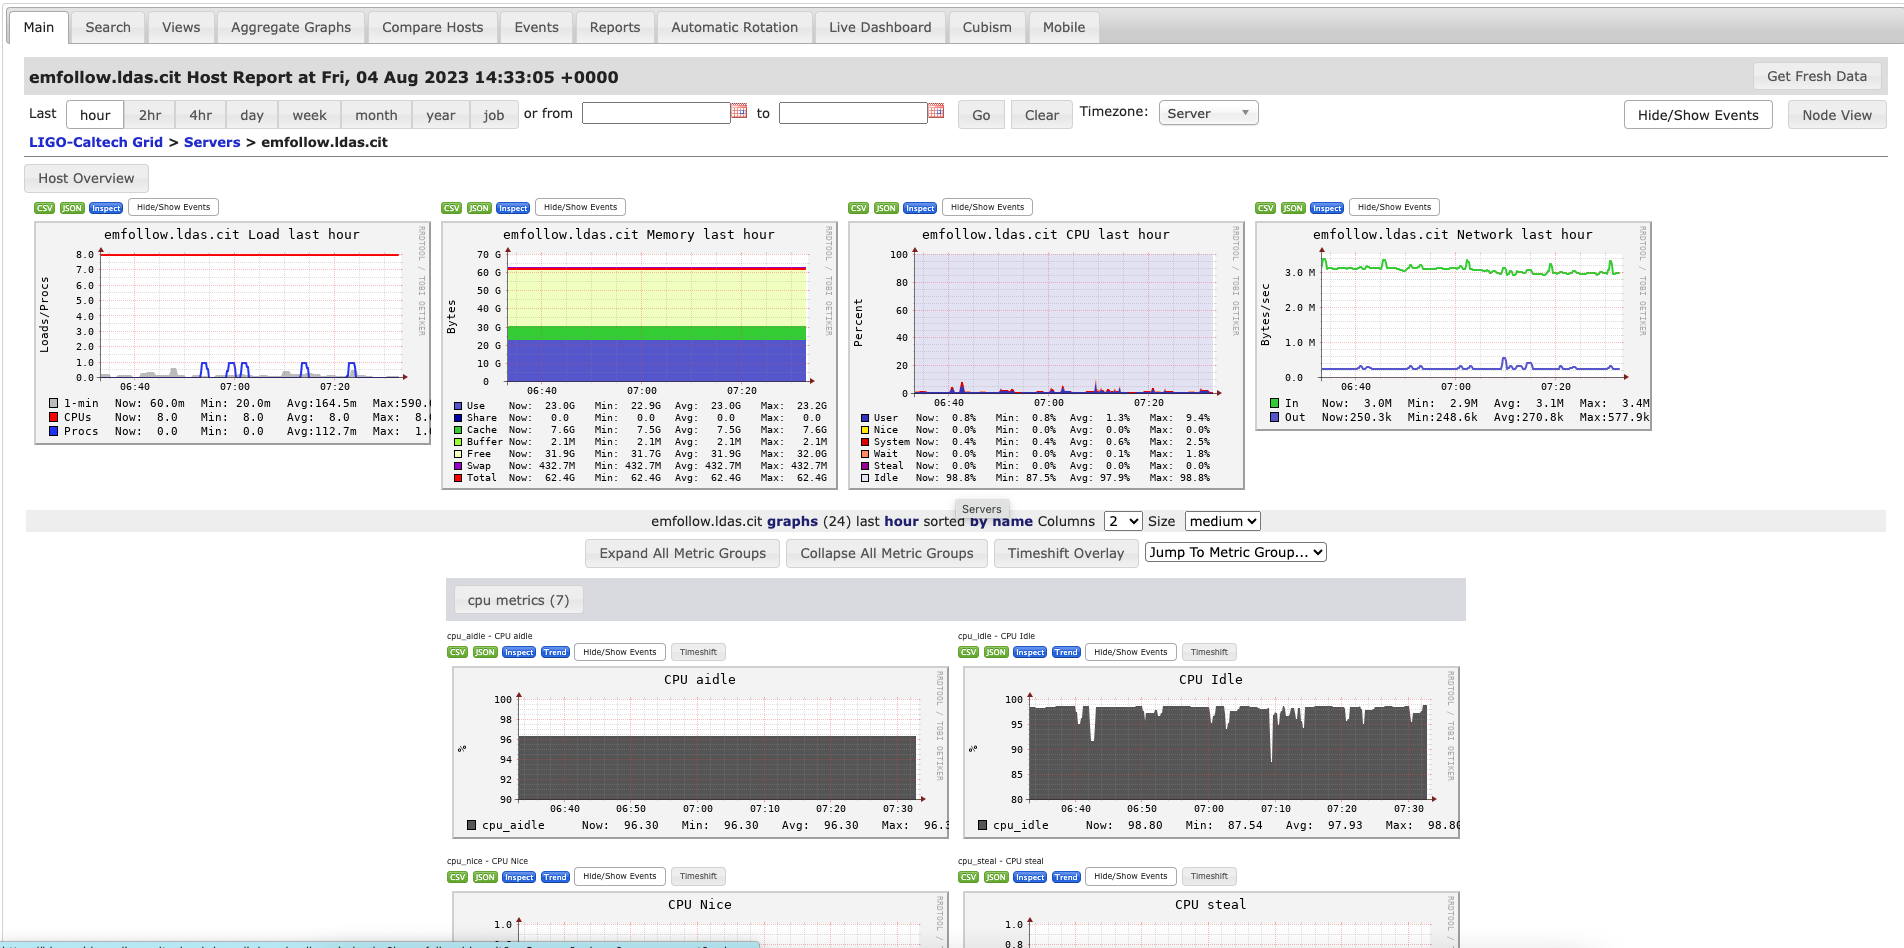
From the top bar the monitoring period can be chosen, ranging form 1 hour to 1 year.
Munin
Minin provides similar information as Ganglia. The machine running the production instance of GWCelery is monitored here.
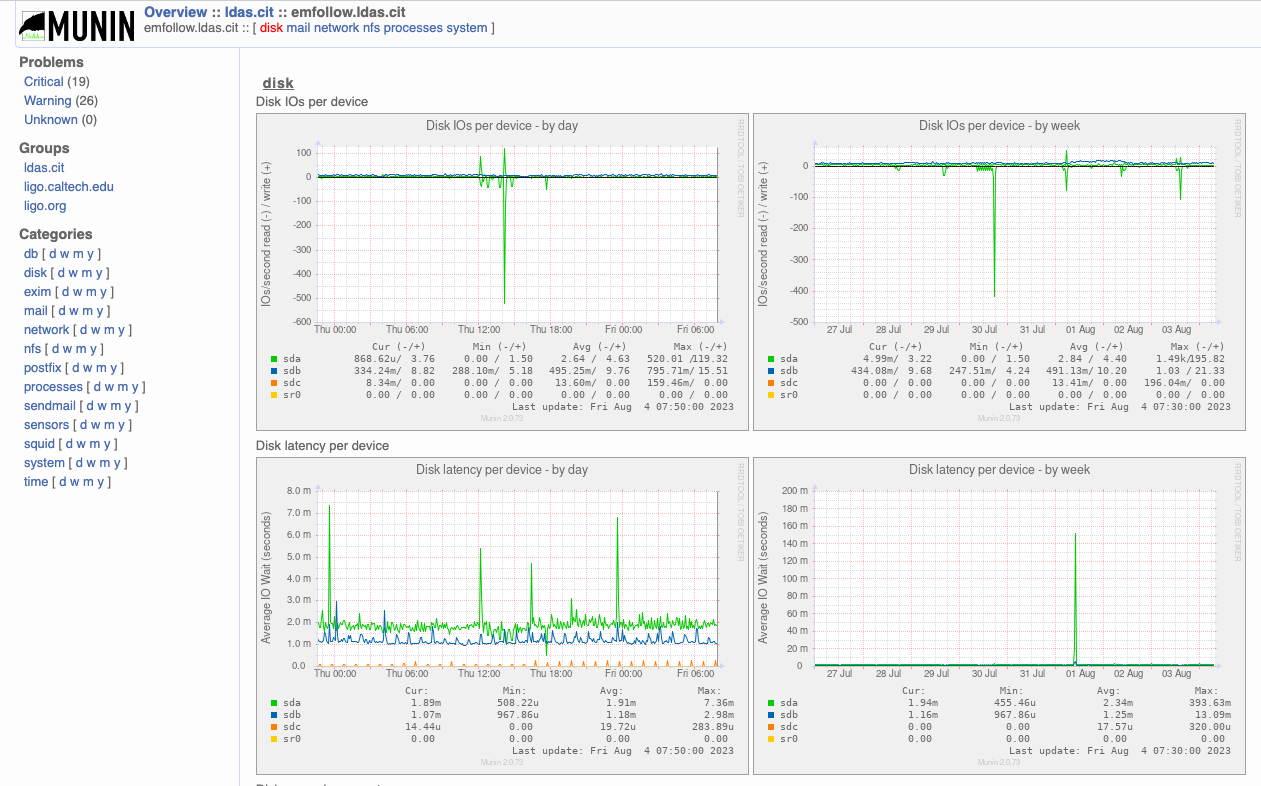
Metrics (i.e. disk or network utilization, processes etc.) are displayed by day or by week.
Flask
GWCelery includes a Flask web application that provides forms to manually initiate certain tasks.
To start Flask for monitoring during local development, run the following command and then navigate to http://localhost:5000/ in your browser:
$ gwcelery flask run
Command-Line Tools
All Celery application provide command-line monitoring and management utilities, including the following:
gwcelery shell: Start an interactive Python or IPython interpreter for interacting with Celery. All tasks as well as theappapplication instance are automatically imported and available as globals. Example:$ gwcelery shell Python 3.6.6 (default, Jun 28 2018, 05:43:53) Type 'copyright', 'credits' or 'license' for more information IPython 6.5.0 -- An enhanced Interactive Python. Type '?' for help. In [1]: download.s('coinc.xml', 'M6757').delay().get()
gwcelery call: Call a task from the command line by passing it arguments in JSON format. The output is the unique identifier of the result. Example:$ gwcelery call gwcelery.tasks.gracedb.download --args='["coinc.xml", "M6757"]' d11099e7-75e5-4aa3-800b-b122b667757c
gwcelery result: Get the result of a previously called task. Example:$ gwcelery result ab4aa6d7-9f21-420c-8401-cbe6863cf7dc (b'<?xml version=\'1.0\' encoding=\'utf-8\'?>\n<!DOCTYPE LIGO_LW SYSTEM "htt' b'p://ldas-sw.ligo.caltech.edu/doc/ligolwAPI/html/ligolw_dtd.txt">\n<LIGO_L' ... b'\t</Stream>\n\t</Table>\n</LIGO_LW>\n')
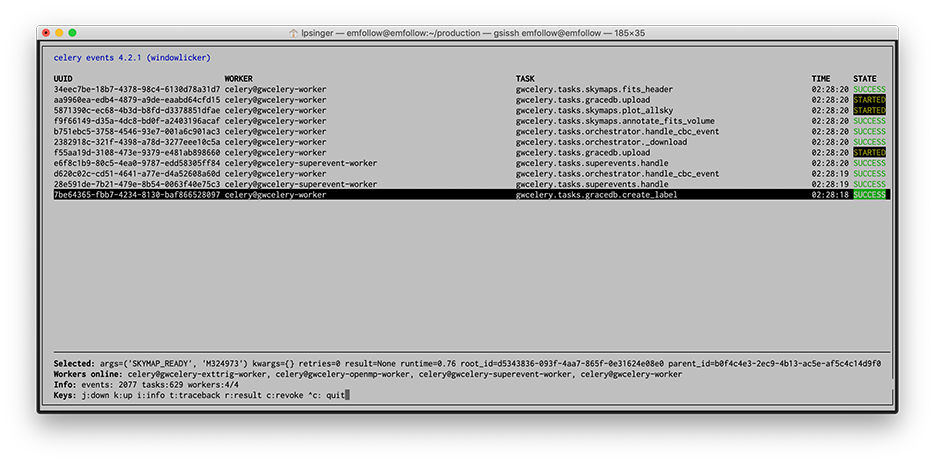
gwcelery events: A text UI monitoring tool that offers functionality similar to Flower. Example:$ gwcelery events